Hiring Analytics
Data that actually
runs your agency
Revenue, billing in flight and projected fees update live, next to time-to-hire, funnel conversion and recruiter activity. The numbers you steer the business on, in one analytics module, with no spreadsheet to maintain.




Analytics module
Six dashboards out of the box
Stop juggling spreadsheets. The ATS computes your KPIs live, project by project, recruiter by recruiter.

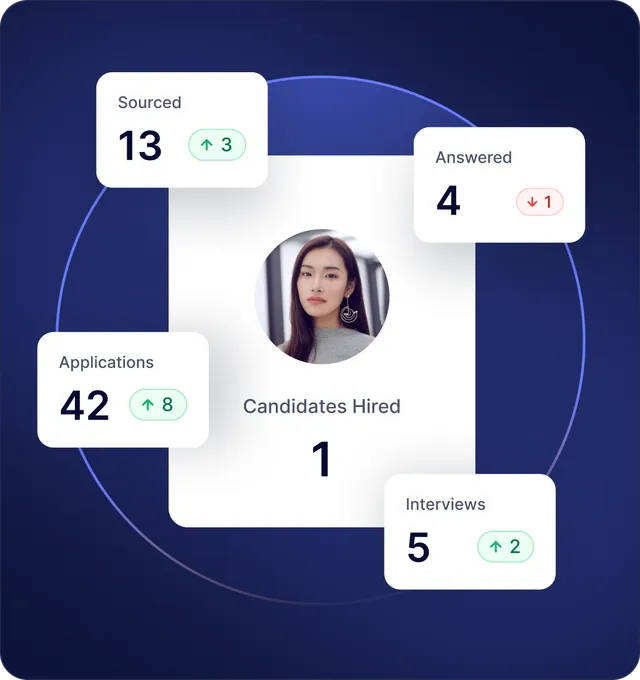
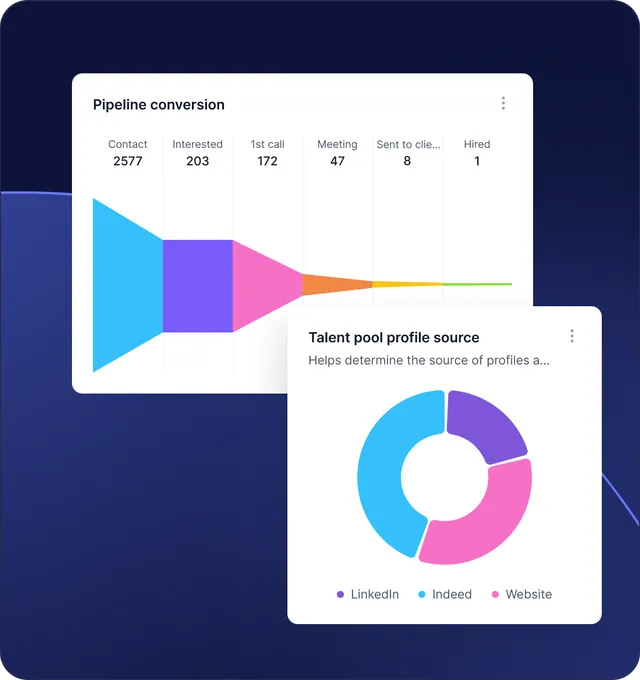
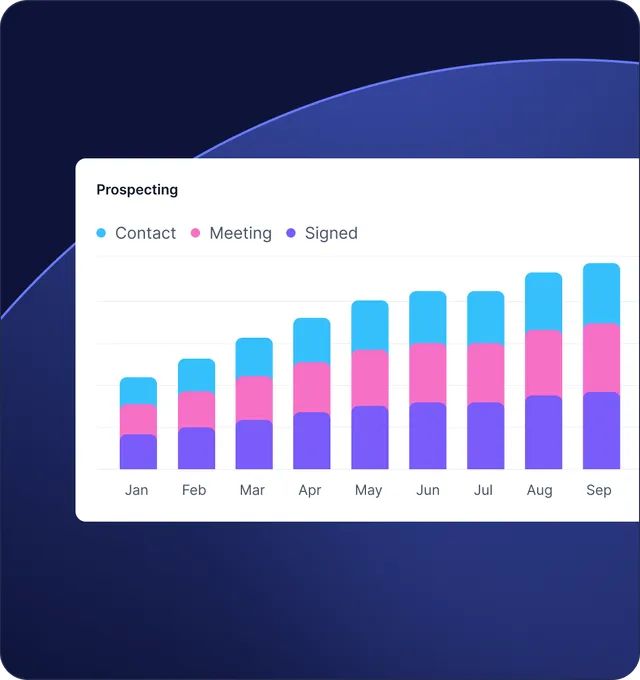
Track your funnel project by project
Time to hire, time to fill and conversion at every status, computed for every project and rolled up across the agency.
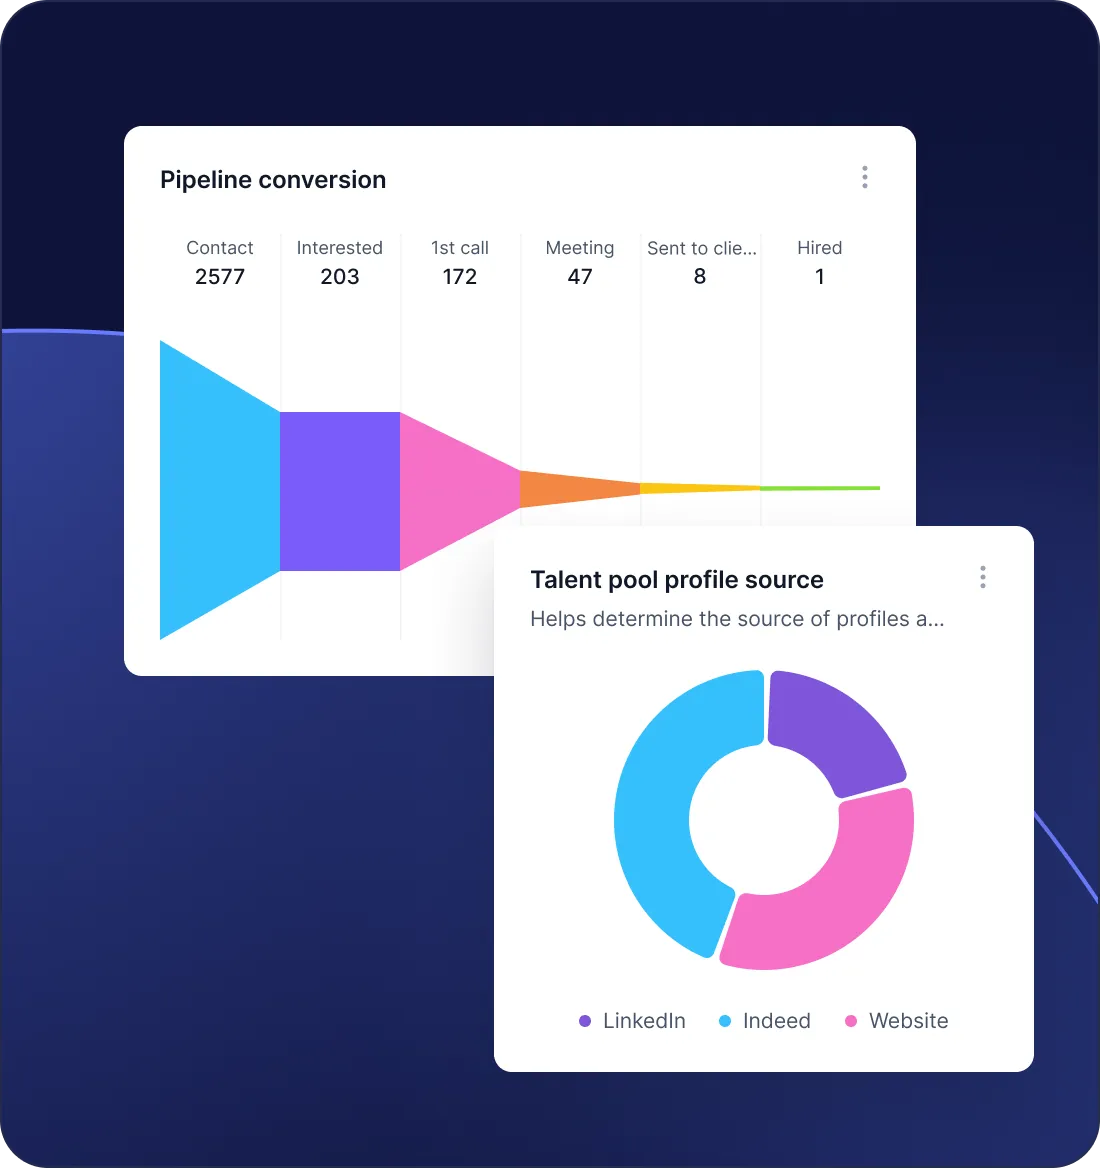
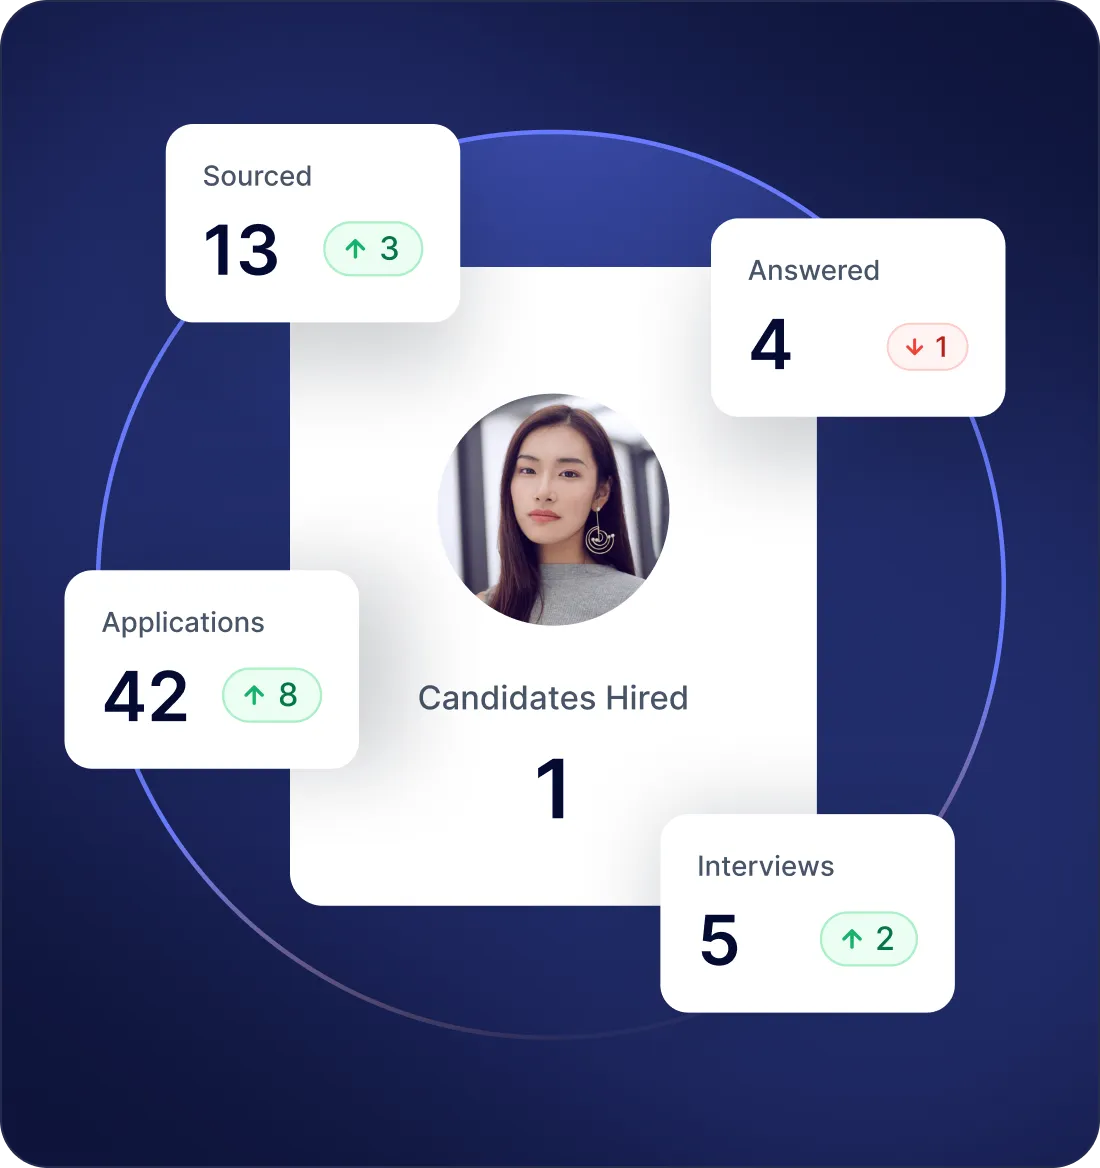
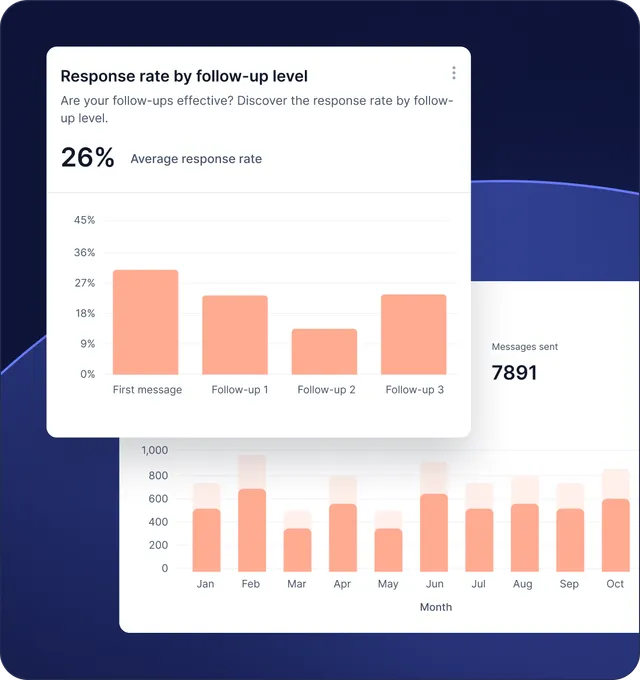
Outreach data, channel by channel, template by template
Every message sent through Jarvi is logged with its channel, template, recruiter and follow-up rank. The dashboards aggregate them into reply, meeting and conversion rates.
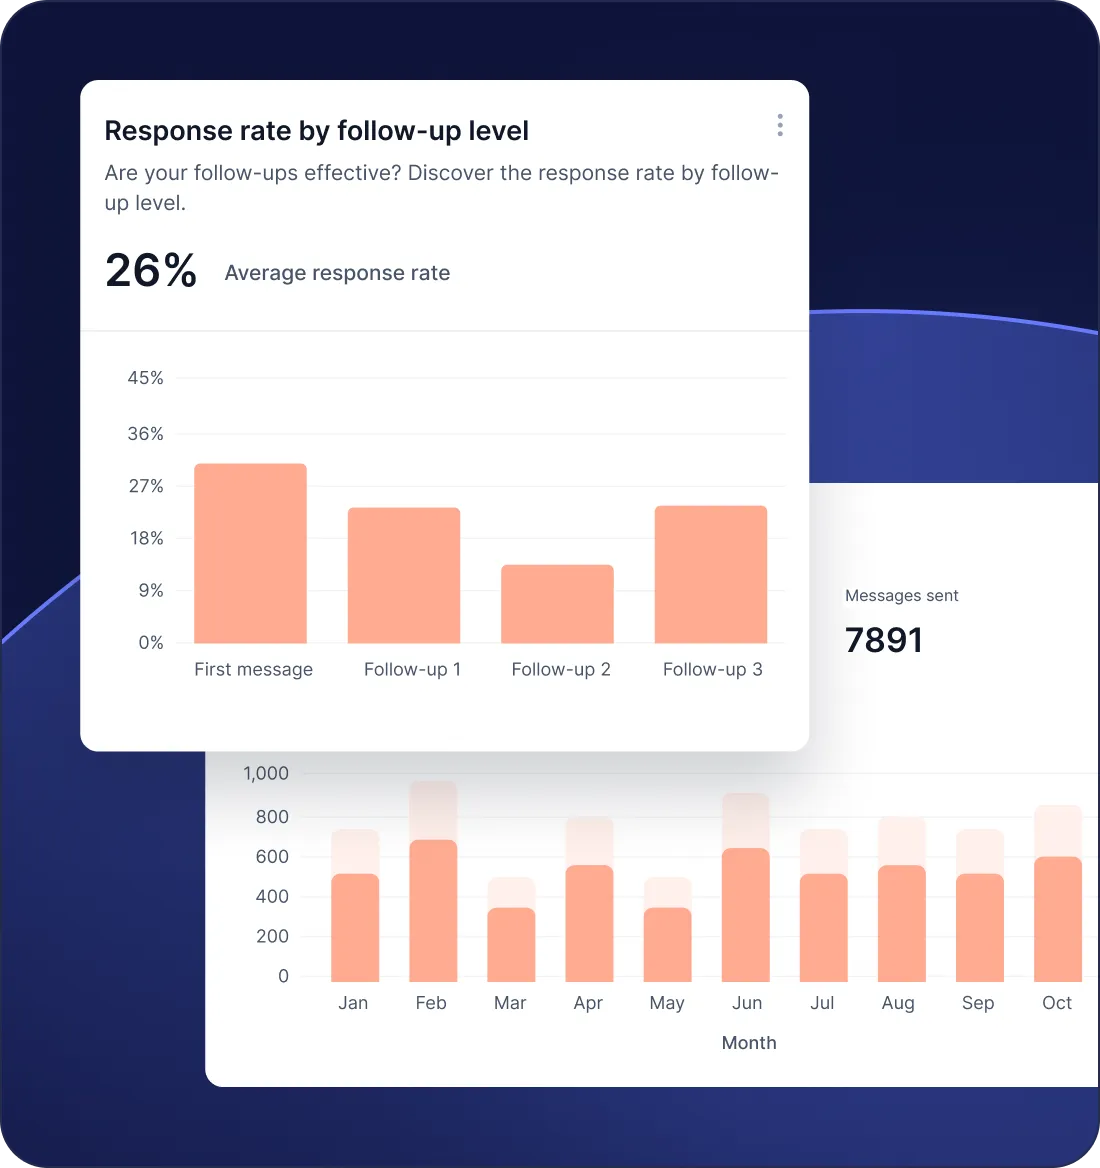
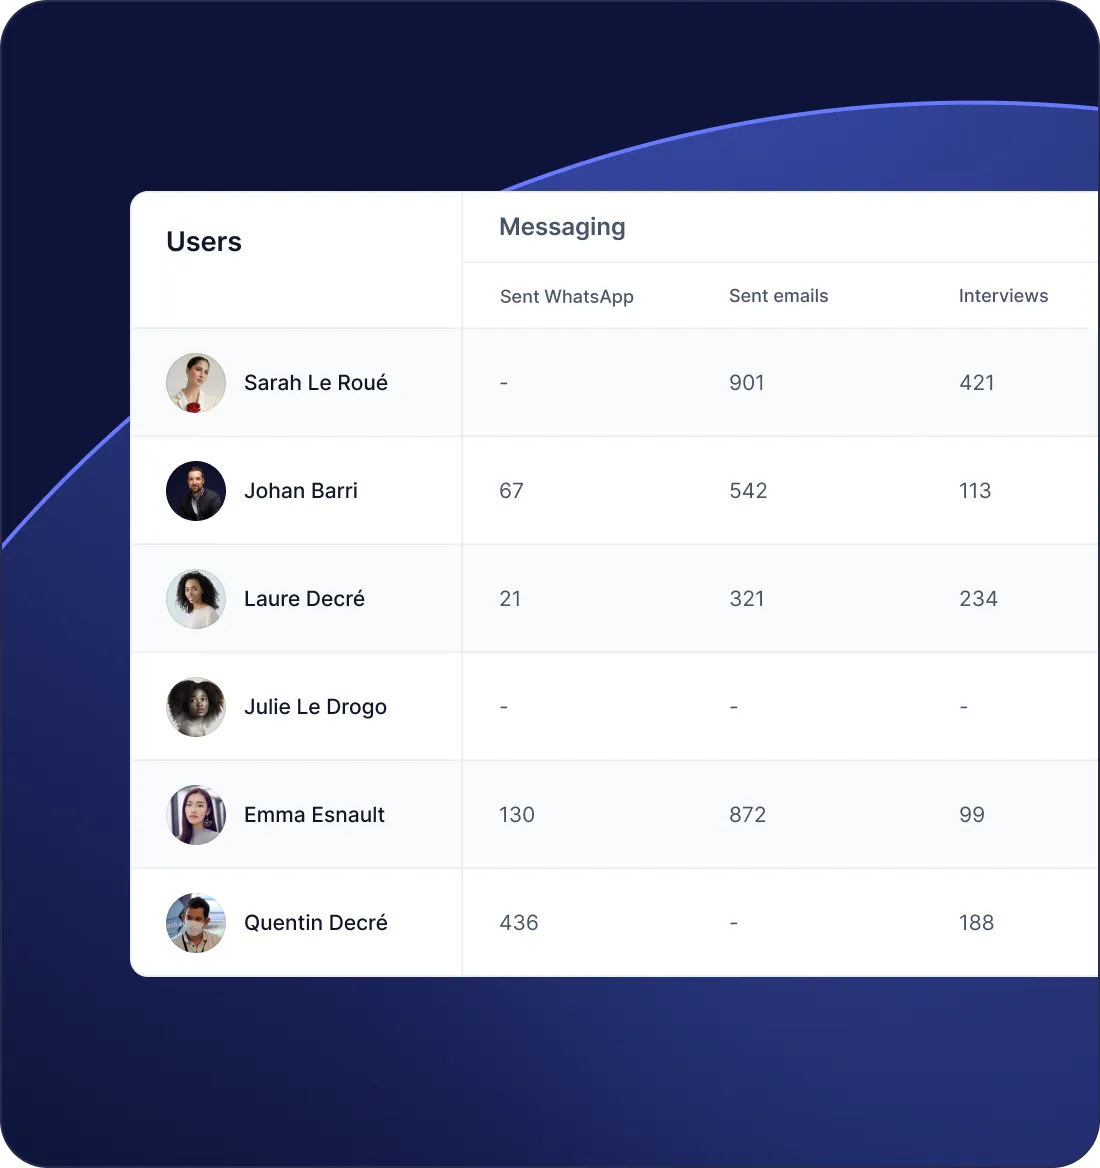
Sourcing channels, ranked by hires
Profiles added by channel, placements closed by channel, and the conversion rate between the two.
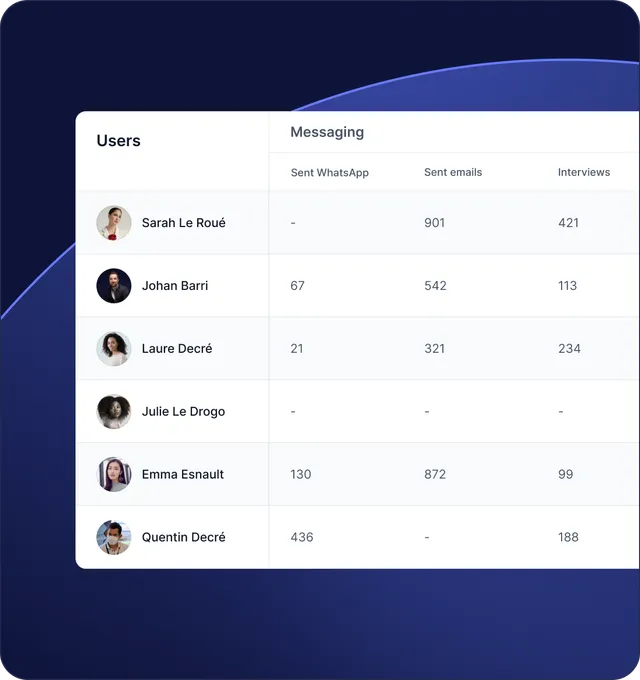
Per-recruiter performance, refreshed live
Activity, funnel movement and outreach effectiveness, broken down for every recruiter. The same data your 1:1s and quarterly reviews already run on.
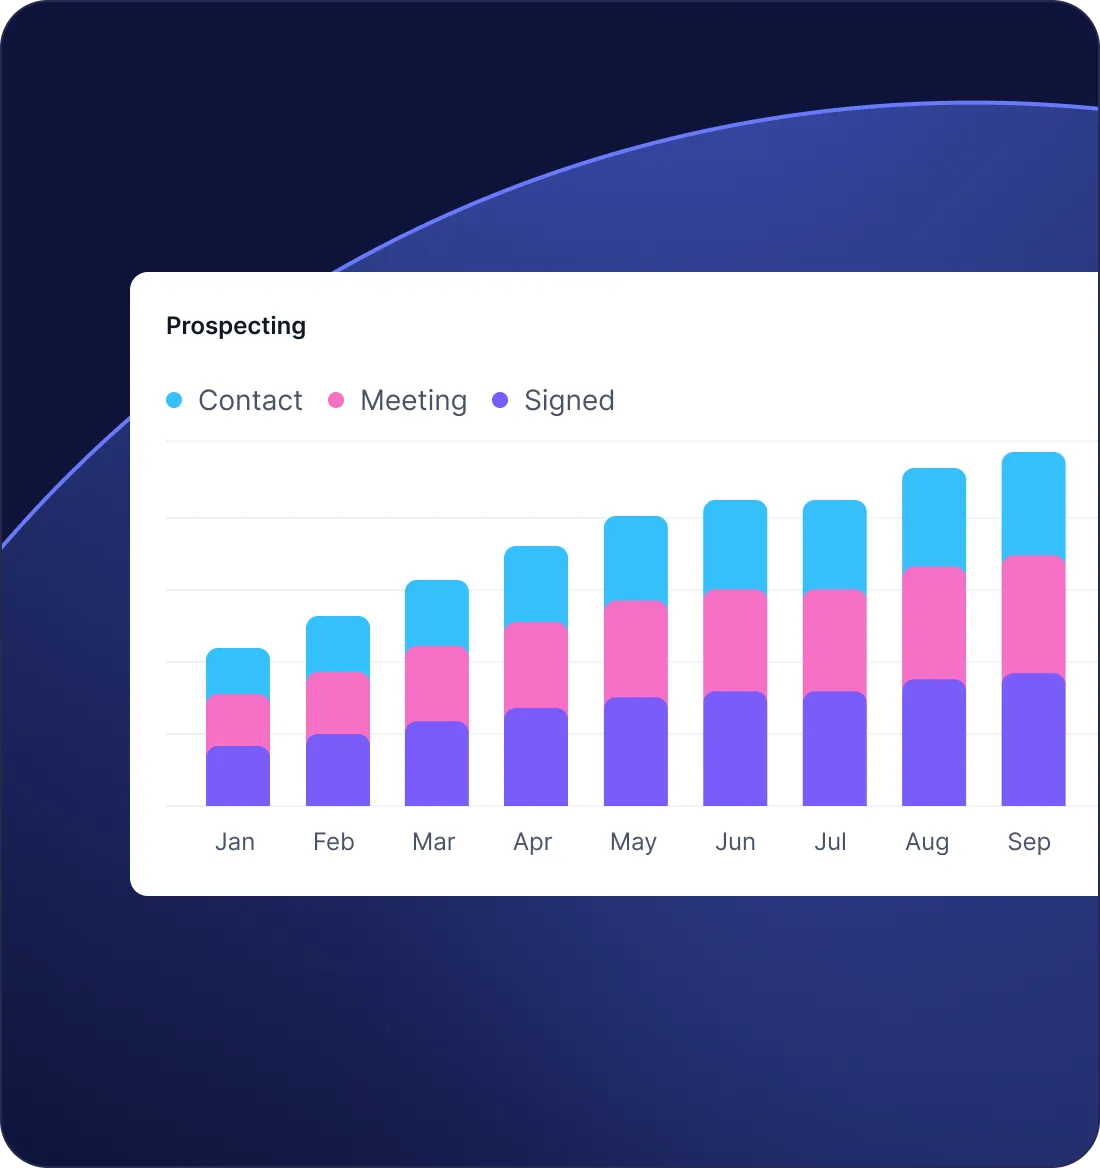
See your agency revenue, live
Book a 30-minute demo and we'll run Jarvi analytics on a dataset that looks like yours, revenue and pipeline included.

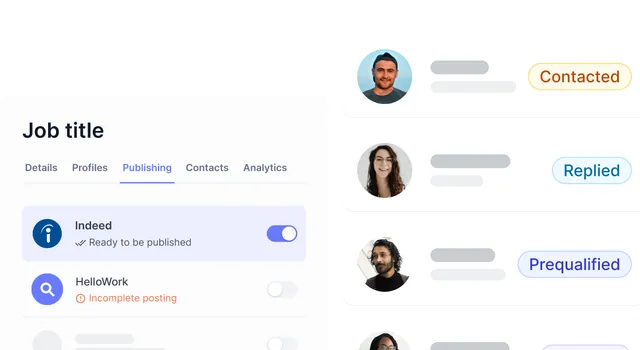
Goodbye spreadsheets
If your hiring KPIs still live in a Google Sheet, here is the side-by-side.
Manual formula, often broken
Time to hire computed automatically on every project
Refreshes when someone updates the file
Real-time, on every dashboard
One file per recruiter, drifting apart
One dashboard everyone sees
Response rate by template is untrackable
Native, per channel and per follow-up rank
Source of hire tagged by hand if at all
Tracked from profiles added to placements closed
Per-recruiter activity hidden in pivot tables
One click on a name to see their full activity
Client report reformatted by hand every month
One-click CSV export from any stat table
Onboarding a new recruiter means training on the file format
New recruiters use the same dashboards from day 1
Permissions: whoever has the link
Granular role-based access
Three views of the same data
Agency owner, freelance recruiter, team lead. Each persona opens Jarvi on the dashboards that fit how they actually work.
For agency owners
Pipeline value, billing in flight and projected revenue update live, with weekly variation flags on every project. The monthly board report becomes two clicks instead of two days.
For freelance recruiters
Time to hire, response rates and pipeline value reachable from one screen, with none of the team-level filters you do not need. Quote deadlines based on your own historical average, not industry guesswork.
For team leads
Per-recruiter activity, funnel progression and outreach effectiveness, broken down by team member. The same numbers anchor 1:1s and quarterly reviews.
Open the dashboards that fit your role
Owner, freelance recruiter or team lead, book a 30-minute demo and see your own numbers in Jarvi.
What gets measured in Jarvi
What is time to hire?
Time to hire is the number of days between a candidate entering the pipeline and being hired. Jarvi computes it per project and as a rolling agency average.
What is time to fill?
Time to fill is the number of days between opening a project and the first hire on it. It captures the full process, including the time spent before the first candidate enters the pipeline.
What is source of hire?
Source of hire is the channel that produced a placement: LinkedIn, Hellowork, CV databases, job boards. Jarvi shows both the channels where profiles are added and the channels where placements close, side by side.
What is conversion rate per stage?
The share of candidates who move from one status to the next. The lowest conversion rate identifies the bottleneck in the process.
What is offer acceptance rate?
The share of offers extended that candidates accept. A drop usually points to salary mismatch, a slow decision cycle, or a problem in the candidate experience before the offer is even sent.
What is reply rate?
The share of contacted candidates who replied at least once. Jarvi reports it by channel, by template and by follow-up rank.
What is meeting rate?
The share of replies that turn into a booked interview. Tracked per template, per channel and per recruiter.
What is pipeline value?
Pipeline value is the total estimated fees of all open projects in the funnel. Jarvi reads your custom fee fields per project and aggregates them at agency level.
Frequently asked questions
Is the data real-time?
Yes. Dashboards run on live database subscriptions, so an action logged in Jarvi appears on the analytics within a few seconds. No manual refresh.
How long does setup take?
The Jarvi platform itself is operational in a few hours. When you migrate from another ATS, count one to two extra weeks depending on how fast your former provider returns the data export. Most reactive accounts go live within the week.
Can I customize what each dashboard shows?
Every Jarvi dashboard is filterable by recruiter, project, period, channel and any custom field you have defined. For exports beyond Jarvi, the public API and Make/Zapier integrations let you pipe metrics into whichever BI tool your team uses.
Can I export the data?
Every stat table in Jarvi exports to CSV in one click. The public API is available on request for deeper integrations.
Who can see what?
Dashboards are gated by role-based permissions. A recruiter sees their own metrics, a team lead sees their team, an admin sees the agency. Custom access maps are available for larger groups.
Where is my data hosted?
Data is hosted on Frankfurt-based servers, encrypted in transit and at rest, with SOC 2 Type 2 certification. The platform is GDPR-compliant.
Can I plug Jarvi data into my own tools?
Yes. Jarvi exposes a public API and integrates with Make and Zapier, so hiring data can flow into a data warehouse or BI tool of your choice.
Replace your hiring spreadsheets
Book a 15-minute walkthrough of Jarvi analytics, run on a dataset that looks like yours.
Recruiters who replaced their spreadsheets with Jarvi
"I save 5 to 10 hours a week and handle 4x more candidates."
Jarvi is my single source of truth — I don’t even check my email anymore.
I set up my campaigns, add candidates to a pipeline, and literally forget about them. Suddenly, candidates are responding and I’m like, where did this person come from?
3 to 4 placements in my first month with Jarvi.
It takes care of the things I don’t want to do and keeps me focused on the parts that are engaging, fun, and bring value.


"2 of us do what others need 5 or 6 for"
“How many people do you have to manage all this?” That’s the question a prospect asked me a few days ago for a recruitment mission. My answer: there are two of us. And I’m proud of it.
Why? Because with two people, we accomplish what others sometimes need five or six for. Not by magic. Not by burning out. But because everything is thought through, structured, and properly equipped. With an ATS that also serves as a CRM, allowing us to track every candidate, every step, every company.

"A tool designed by recruiters, for recruiters"
We needed an accessible, smart and efficient ATS to structure our recruitment activity. Jarvi was the obvious choice: a tool designed by recruiters, for recruiters. 💡

"Less time searching, more talent recruited!"
Less time searching, more talent recruited!

"We have x4 our placements!"
We’ve have done as much recruitments in 3 months as we did last year! We don’t necessarily need to increase the team size, it’s just that we’re all becoming much more productive!
Analytics is one of four Jarvi products
Explore the ATS, CRM and AI Agent built on the same data.
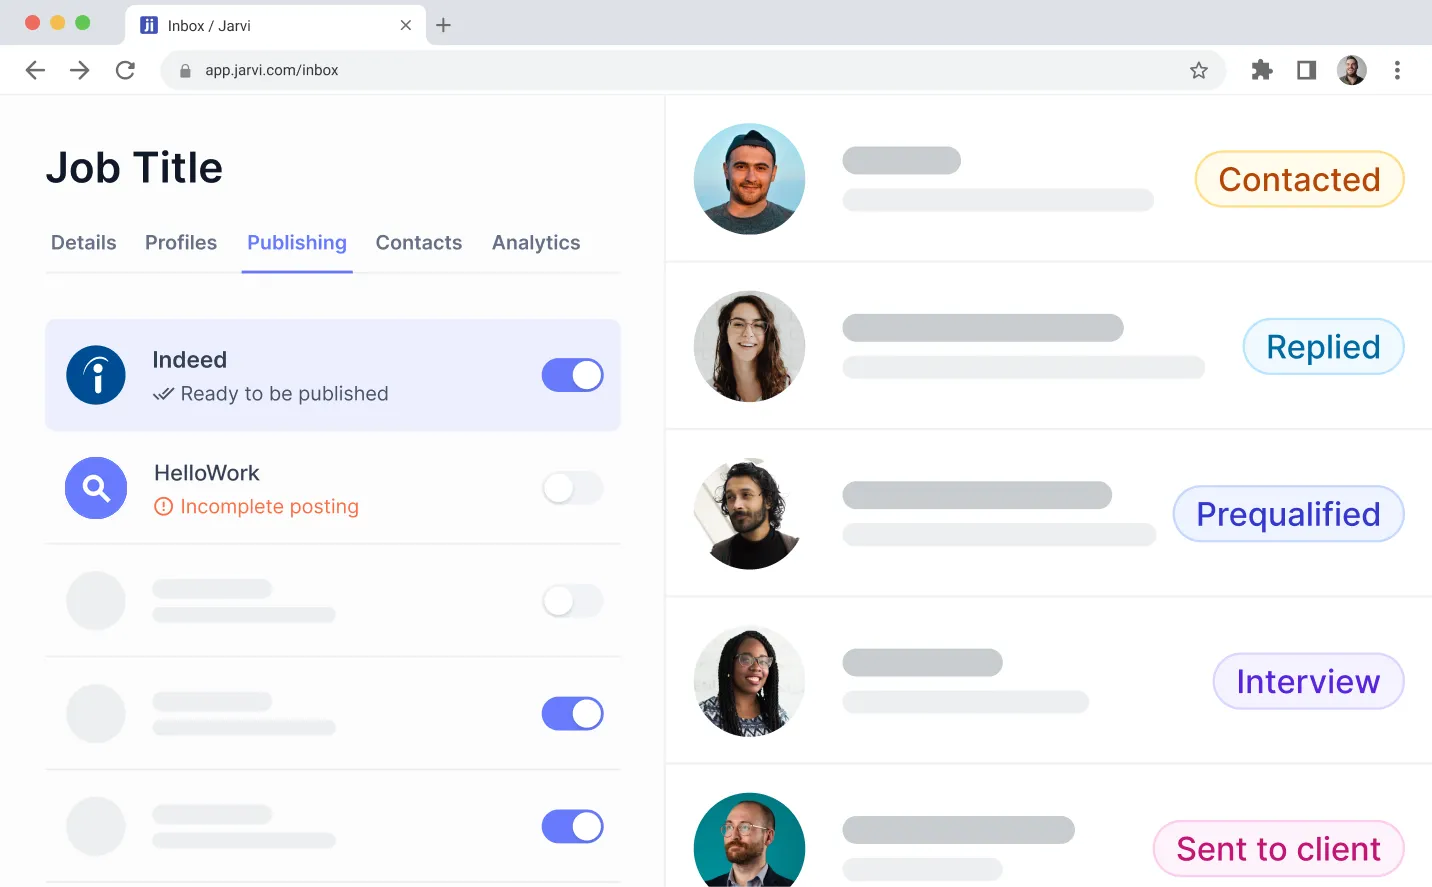



Built by recruiters, for recruiters
Replace your hiring spreadsheets with Jarvi analytics in under a week.