ATS Reporting
Recruitment and revenue metrics,
live in your ATS.
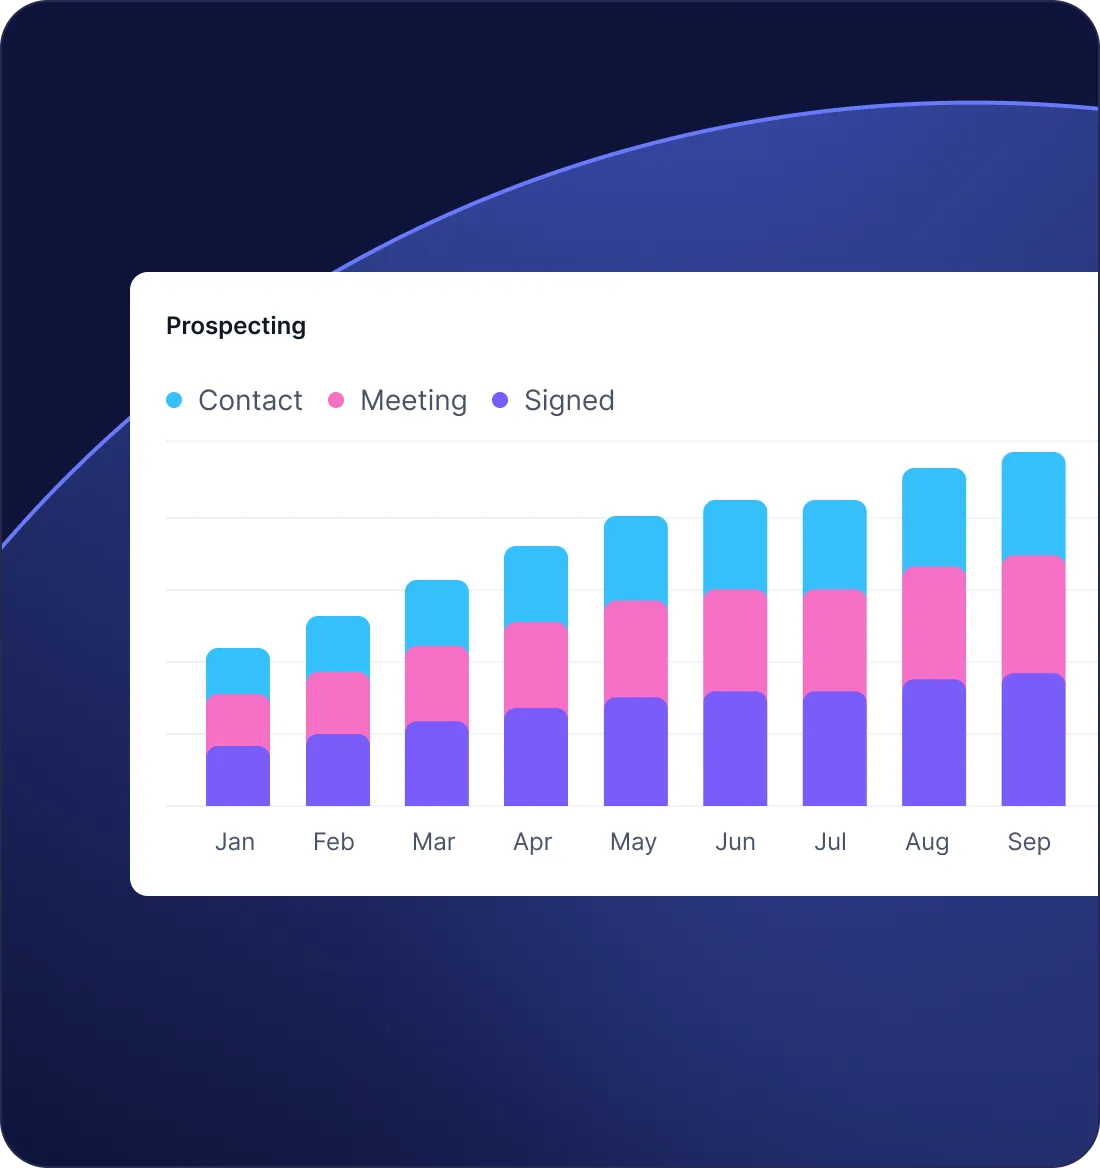
Pipeline, conversion, time-to-hire, team activity and revenue, computed live from your ATS data. Build a custom dashboard through the Jarvi API, or just ask Jarvi AI in plain English: 'who booked the fewest meetings this month?'




Five angles
Five reports.
One source of truth.
A complete recruitment reporting suite for agencies: sourcing, recruitment process, projects, accounts, team activity. The views agencies open every week, in the same ATS that holds the data.

Find the leak in your funnel.
Plug it the same week.
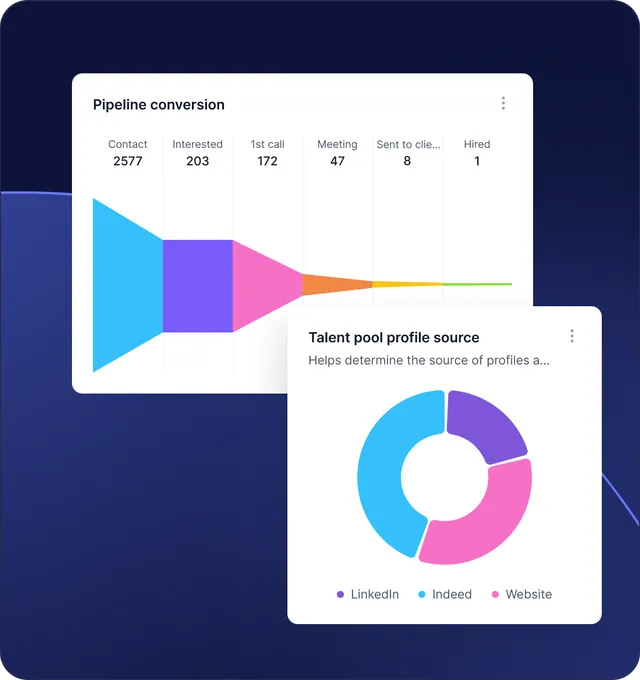
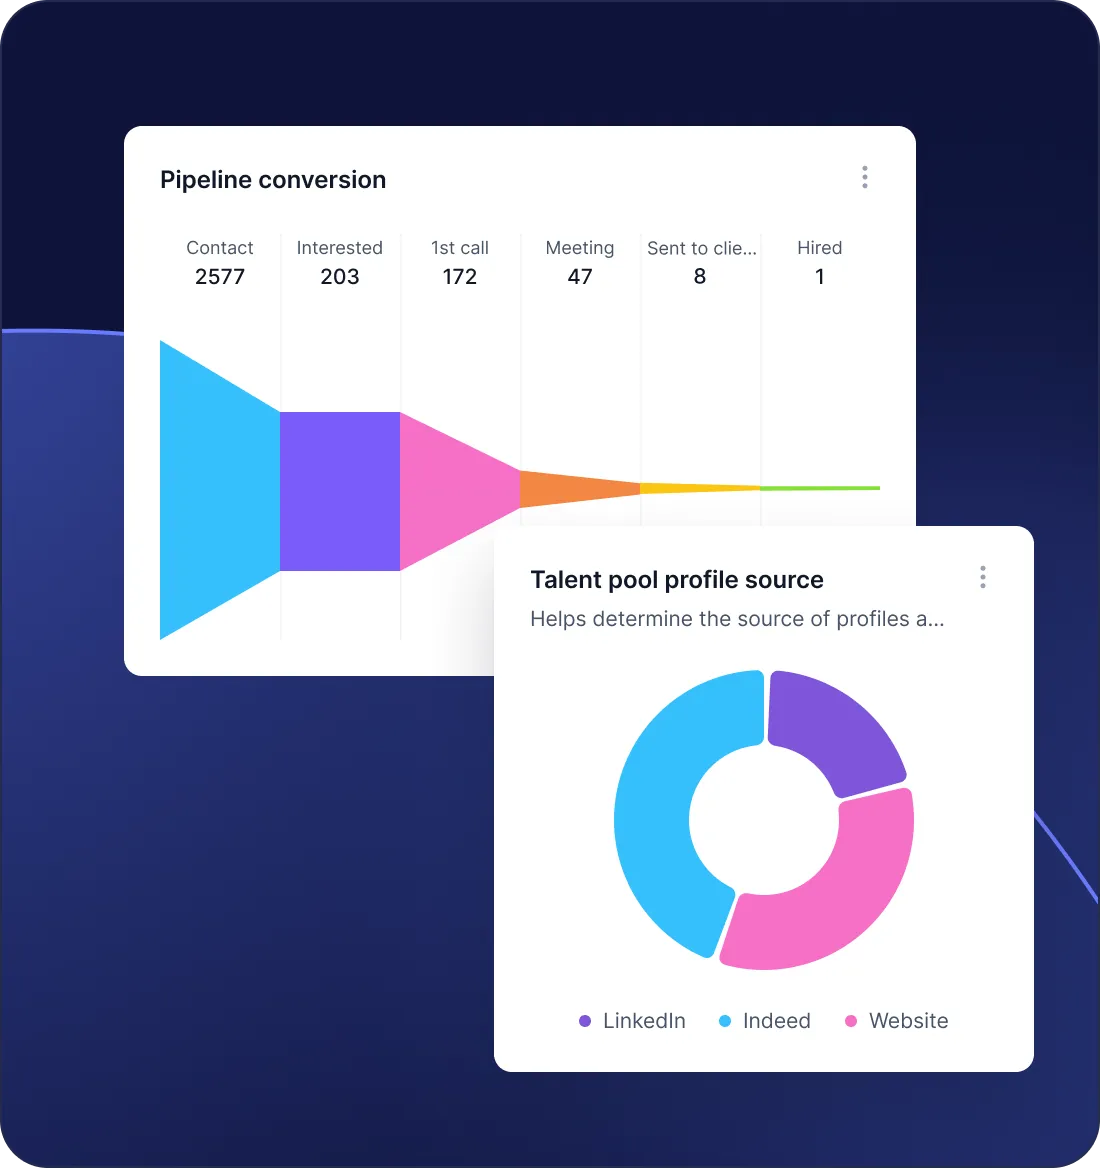
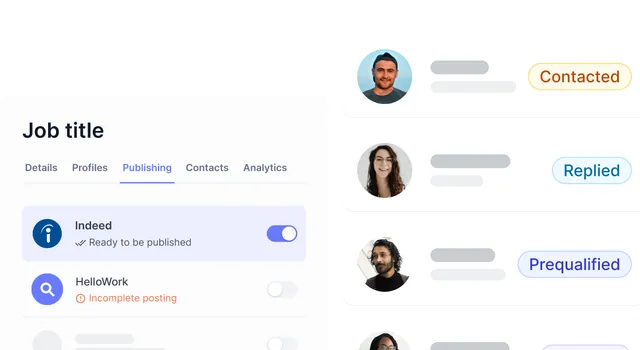
A recruitment funnel report that turns every status change in your ATS into a hiring metric you can act on, the moment it happens.
See these reports on your own pipeline
Book a 30-minute demo and we'll open your funnel, sourcing and team reports on your real data.

For agencies still piloting from a spreadsheet
The Monday morning review,
without the Sunday evening copy paste.
If your weekly recruitment numbers live in a Google Sheet, you already know how brittle that gets. Here is what changes when reporting sits inside your applicant tracking system, where the data sits.
| In a spreadsheet | In Jarvi | |
|---|---|---|
| Time to build the weekly review | 2 to 4 hours, every week | Already done, just open it |
| Data freshness | As fresh as your last copy paste | Live, second by second |
| Time-to-hire by stage | Manual stopwatch per candidate | Computed from status changes |
| Per-recruiter performance | Trust the self-reported numbers | Counted from real actions in the ATS |
| Revenue forecast (fee, salary) | One formula per project, fragile | Aggregated in one chart, any custom field |
| Drill from a chart down to a candidate | Impossible | One click |
| Sharing with the client | Export, format, attach | Open the project view, share the link |
| Permissions and audit trail | None | Built in |
From question to chart
The questions agencies ask weekly,
mapped to a report.
You do not need a BI analyst to run an agency. You need the right chart open at the right moment. Here are the ones our customers open most.
| The question you ask on Monday | The report that answers it |
|---|---|
| "Why did we miss our placements target this month?" | Recruitment funnel, stage-by-stage conversion |
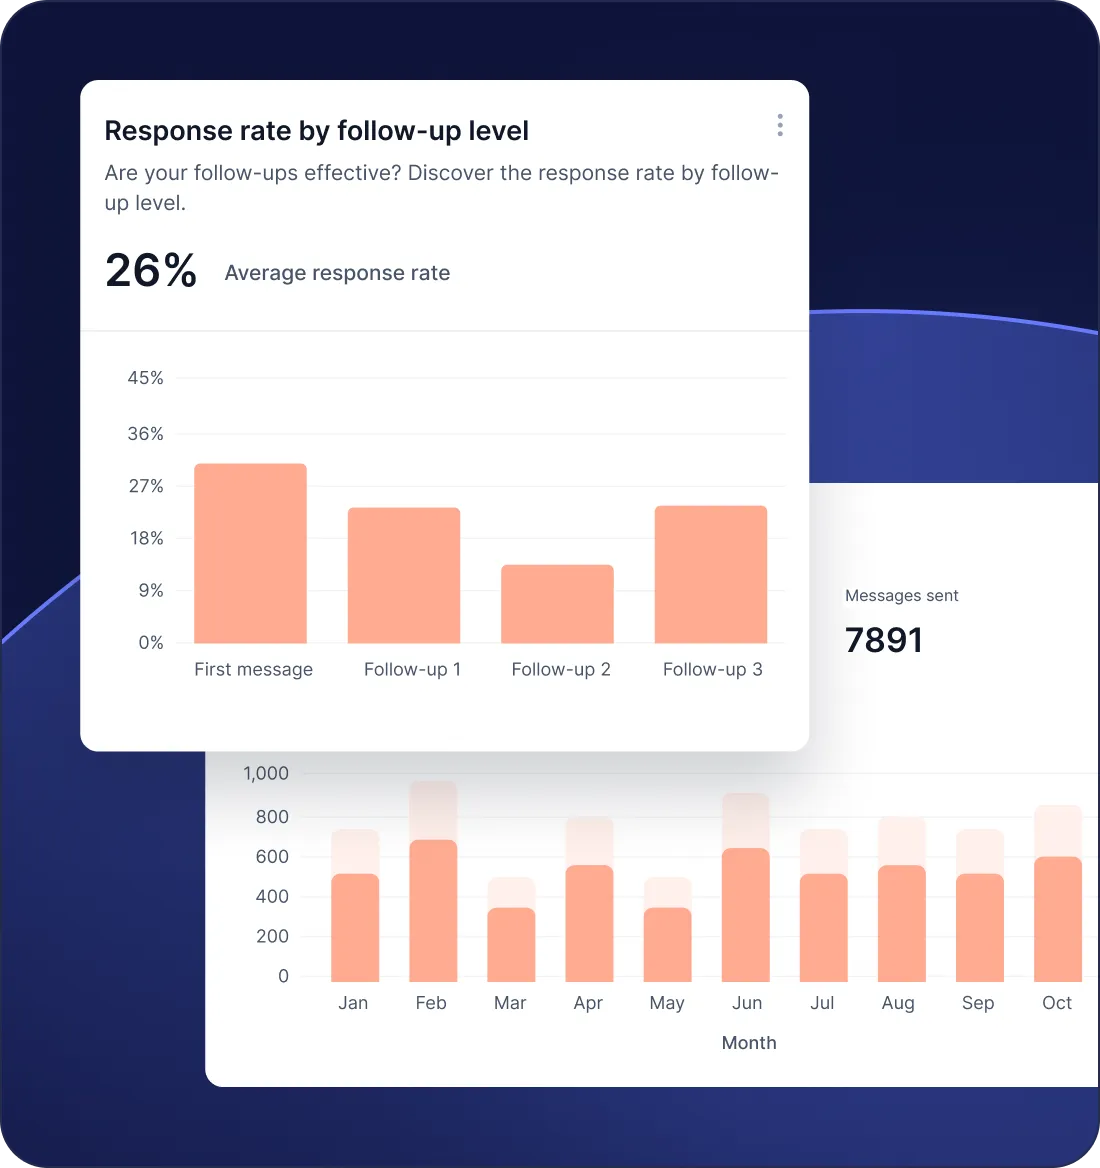
| "Is WhatsApp outperforming email for first contact?" | Response rate by channel |
| "Which sourcing channels actually convert into hires?" | Source attribution, first-touch and last-touch |
| "Is Sarah behind on her sourcing this week?" | Team activity datagrid, recruiter filter |
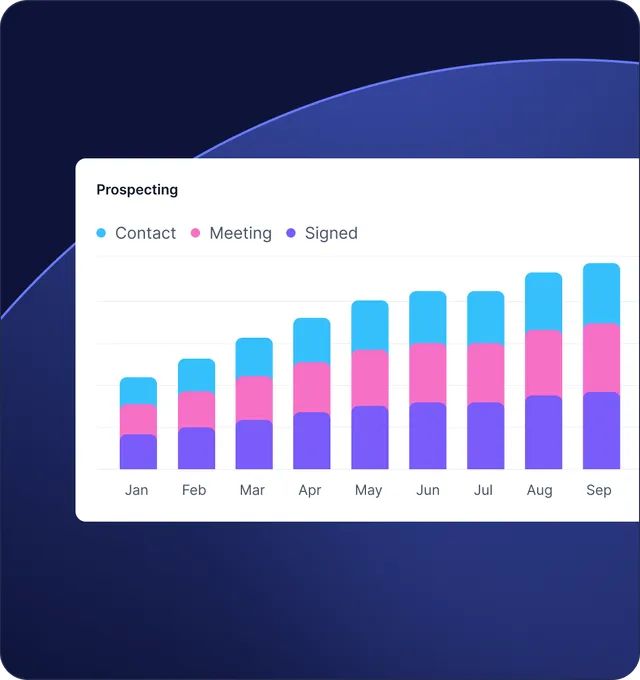
| "How much revenue is realistically going to land next quarter?" | Project pipeline, custom field sum |
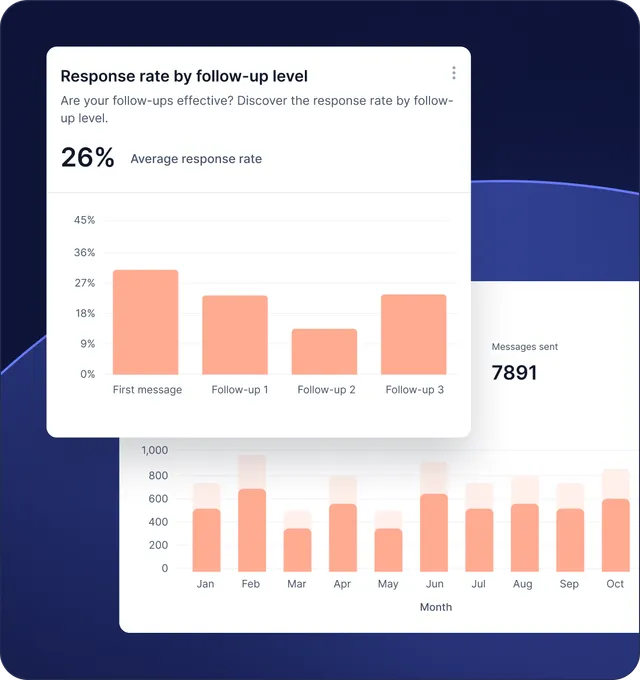
| "Did our follow-up sequence improve reply rates?" | Response rate by follow-up level |
| "Which clients should I push harder this week?" | Account pipeline, recent activity |
| "Who has been sitting too long at the offer stage?" | Funnel drill-down, time per stage |
Coach with evidence.
Ready for one-on-ones and reviews.
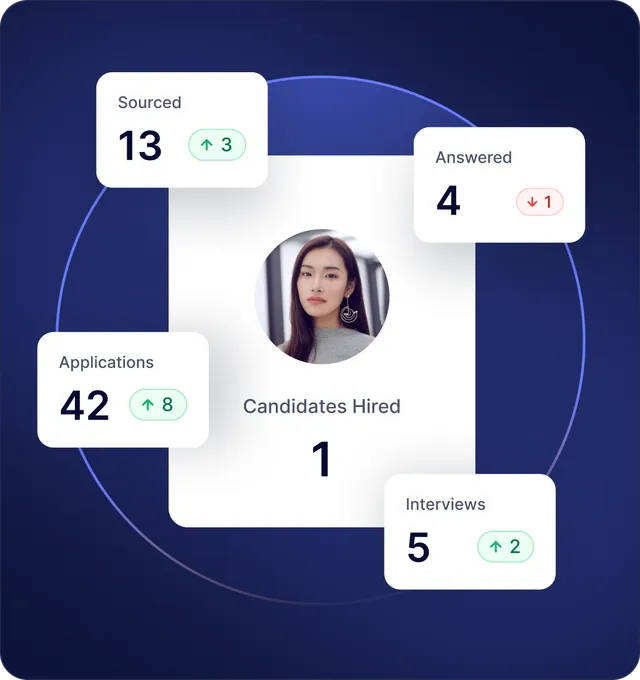
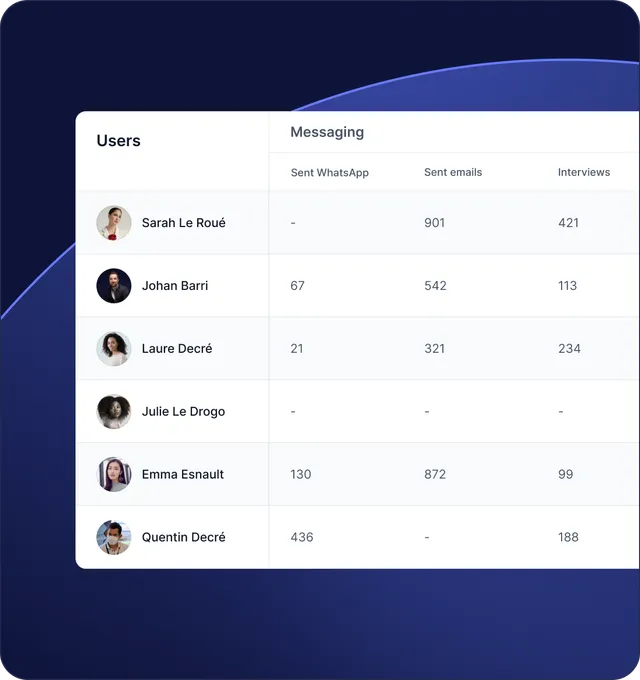
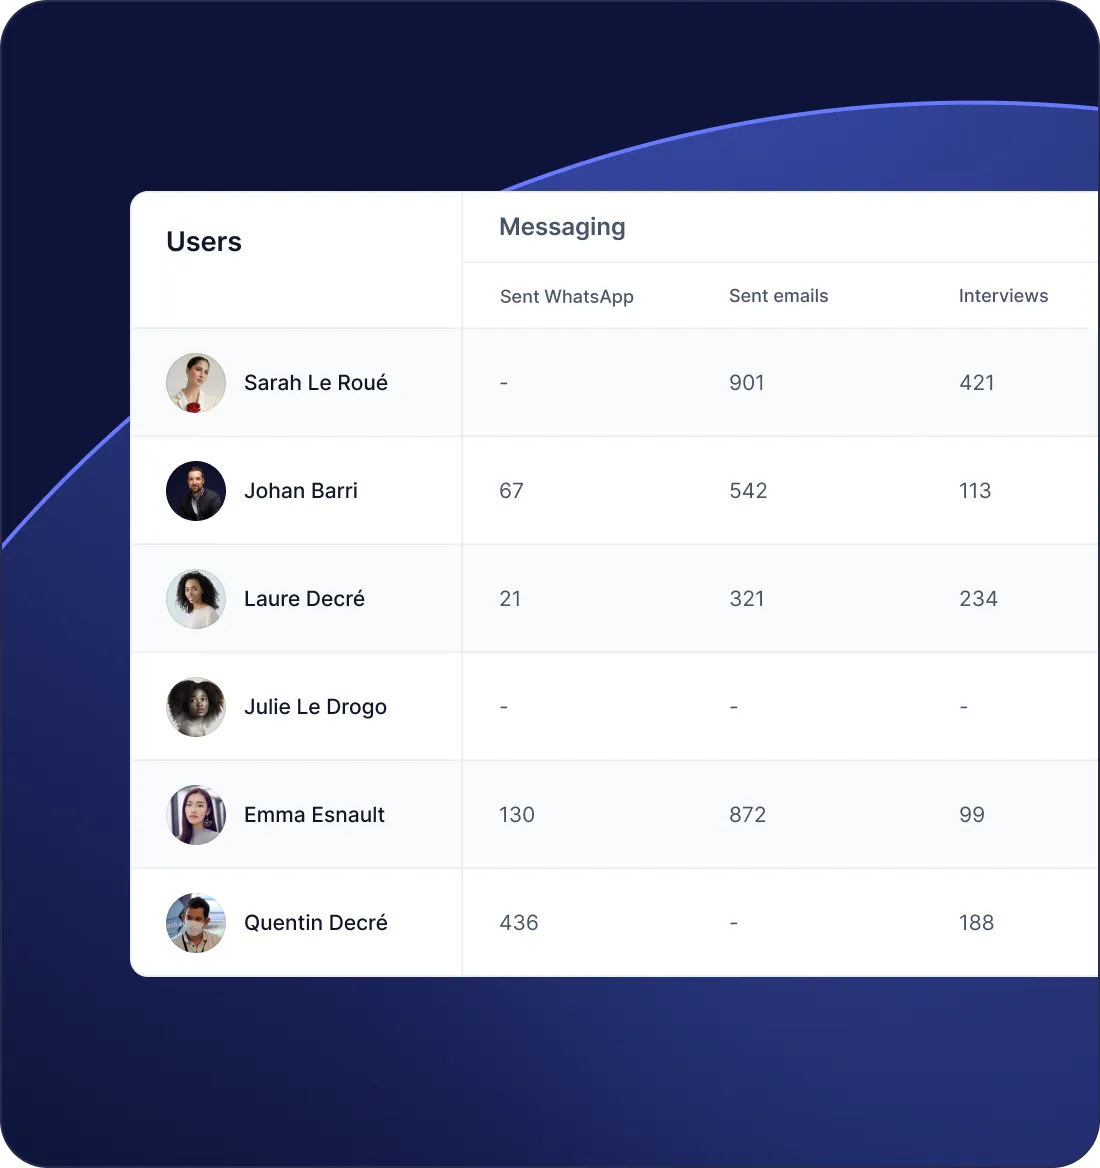
Recruiter performance analytics, scoped to the window you need. See who is doing what, on which channel, with what result. Pairs naturally with the recruitment outreach data already flowing in.
Stop reporting from a spreadsheet.
The numbers your agency runs on, ready every Monday morning, live in your ATS.
Recruiters speak out
"I save 5 to 10 hours a week and handle 4x more candidates."
Jarvi is my single source of truth — I don’t even check my email anymore.
I set up my campaigns, add candidates to a pipeline, and literally forget about them. Suddenly, candidates are responding and I’m like, where did this person come from?
3 to 4 placements in my first month with Jarvi.
It takes care of the things I don’t want to do and keeps me focused on the parts that are engaging, fun, and bring value.


"2 of us do what others need 5 or 6 for"
“How many people do you have to manage all this?” That’s the question a prospect asked me a few days ago for a recruitment mission. My answer: there are two of us. And I’m proud of it.
Why? Because with two people, we accomplish what others sometimes need five or six for. Not by magic. Not by burning out. But because everything is thought through, structured, and properly equipped. With an ATS that also serves as a CRM, allowing us to track every candidate, every step, every company.

"A tool designed by recruiters, for recruiters"
We needed an accessible, smart and efficient ATS to structure our recruitment activity. Jarvi was the obvious choice: a tool designed by recruiters, for recruiters. 💡

"Less time searching, more talent recruited!"
Less time searching, more talent recruited!

"We have x4 our placements!"
We’ve have done as much recruitments in 3 months as we did last year! We don’t necessarily need to increase the team size, it’s just that we’re all becoming much more productive!
Recruitment and business metrics, defined
The KPIs your agency reports on,
defined the way Jarvi computes them.
A short reference for new managers, and for anyone who wants two recruiters to mean the same thing when they say "time to hire".
Time-to-hire
Days between a candidate entering your pipeline and the hired status. Computed per candidate from their first appearance in any project to the placement.
Time-to-fill
Days between opening a project and filling it. Measured from project creation to the first candidate hired. Includes the days the project sat open before any candidate was sourced.
Stage conversion rate
Share of candidates who move from one pipeline stage to the next. Shown side by side at every stage of your funnel.
Offer acceptance rate
Share of offers signed versus offers sent. Computed from the offer-sent and offer-signed status changes in your pipeline.
Source effectiveness
Share of profiles and hires coming from each origin (LinkedIn, HelloWork, job boards, referrals, your talent pool). Computed both at entry, how each profile reached Jarvi, and at hire, which channel led to the placement.
Response rate by channel
Share of outreach that gets a reply, broken down by channel: email, WhatsApp, Telegram, SMS, calls.
Revenue and pipeline value
Sum of any numeric field on your projects (fee, salary, expected revenue) per stage. Realized billing and forecast, updated live as projects move.
Per-recruiter activity
Manual actions, messages sent, status changes, attributed to each user over a period. The fair input for one-on-ones and bonus reviews.
Ask your ATS your hardest question
From revenue forecasts to recruiter performance, put Jarvi AI to work on your reporting. Book a 30-minute demo on your own data.
Frequently asked questions
How fresh is the data in my reports?
Live. The moment a recruiter moves a candidate or sends a message, it shows up in your charts. No nightly batch, no caching surprises.
What is the difference between time-to-hire and time-to-fill?
Time-to-hire is per candidate, from their first appearance in your pipeline to recruitment. Time-to-fill is per project, from project creation to first hire. Most agencies report on both: clients ask for time-to-hire, internal pipeline reviews lean on time-to-fill.
Do I need a data analyst to use this?
No. The reports answer the questions agencies ask every week, already wired to your data. If you want to push the numbers elsewhere, every chart in the stats section exports to CSV and a public API is available on demand.
Can I export the raw numbers?
Yes. Every chart in the stats section exports to CSV. Hand the file straight to finance, your client, or wherever you need the data to go.
Can I track custom fields like fee, salary, or projected revenue?
Yes. Any numeric field on your projects can be summed and tracked stage by stage, with both cumulative and variation views.
What time periods can I compare?
Several preset windows (week, month, quarter, half-year, year, plus rolling 7, 30, 90, 180, 365 days, plus the previous equivalents) and any custom range you set yourself.
Do reports respect roles and permissions?
Yes. Recruiters see what they should see, managers see the whole picture, deactivated users can be hidden from team comparisons in one click, and every action is logged in the audit trail with the channel, the user and the timestamp.
Will reporting work on imported data from my old ATS?
Yes. As soon as your existing data lands in Jarvi, the reports populate. Status changes from before the import are recomputed when the source system provided them, otherwise they start the day you switch. A typical migration takes one to two weeks, depending on how quickly your previous provider returns the export.
Is reporting included in every Jarvi plan?
Yes. Jarvi has a single plan. Reporting is part of the core ATS, no add-on, no premium dashboard tier.
Beyond reporting.
Pair Jarvi reporting with the CRM and outreach modules your team already uses every day.



Built by recruiters who got tired of rebuilding the same spreadsheet.
See your own pipeline in Jarvi, with your own data, in 30 minutes.