The information is customizable and specific to each user based on your settings. The information presented in this tutorial may differ from yours as we use our own statuses and stages, but the reading remains the same.
How to read the interface?
On the left, you’ll find the different statistics groups. In the center, filters to refine your results. On the right, block management to display the desired elements.
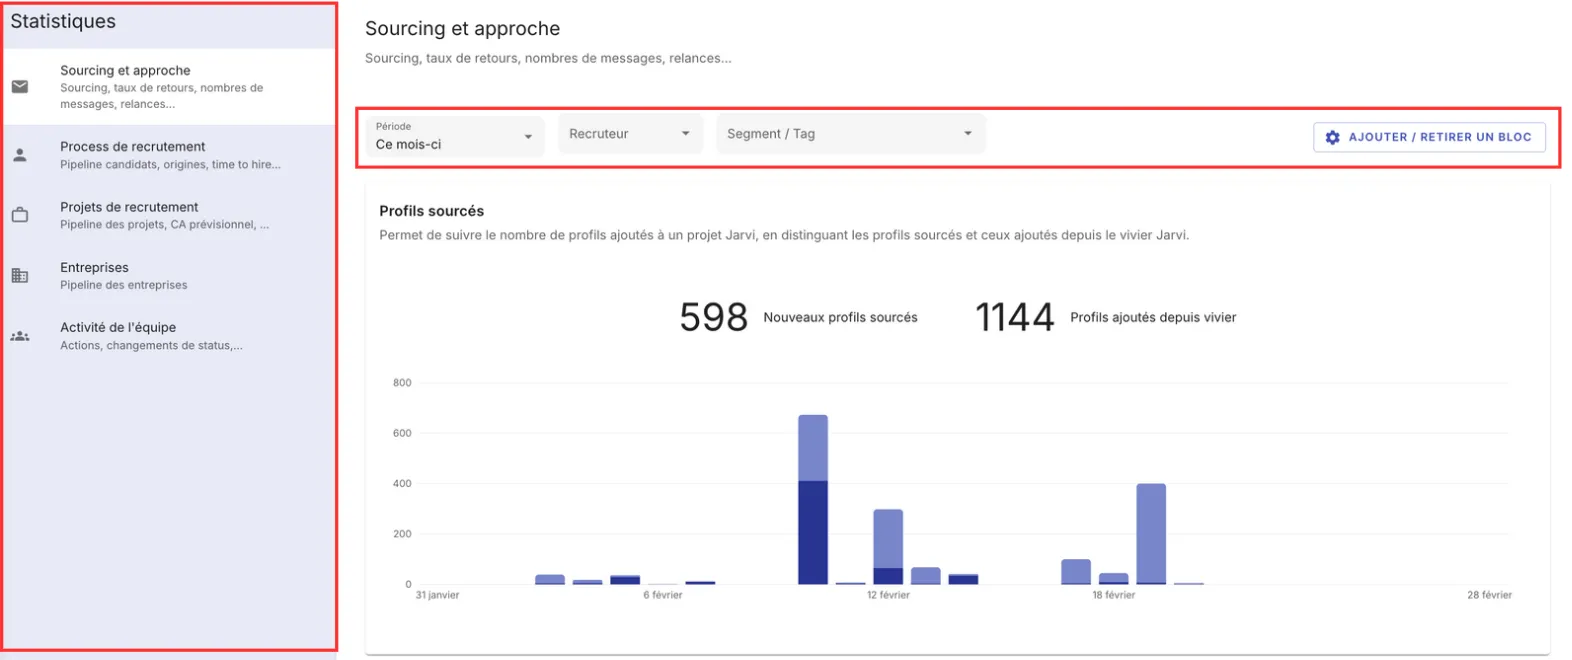
Sourcing and outreach
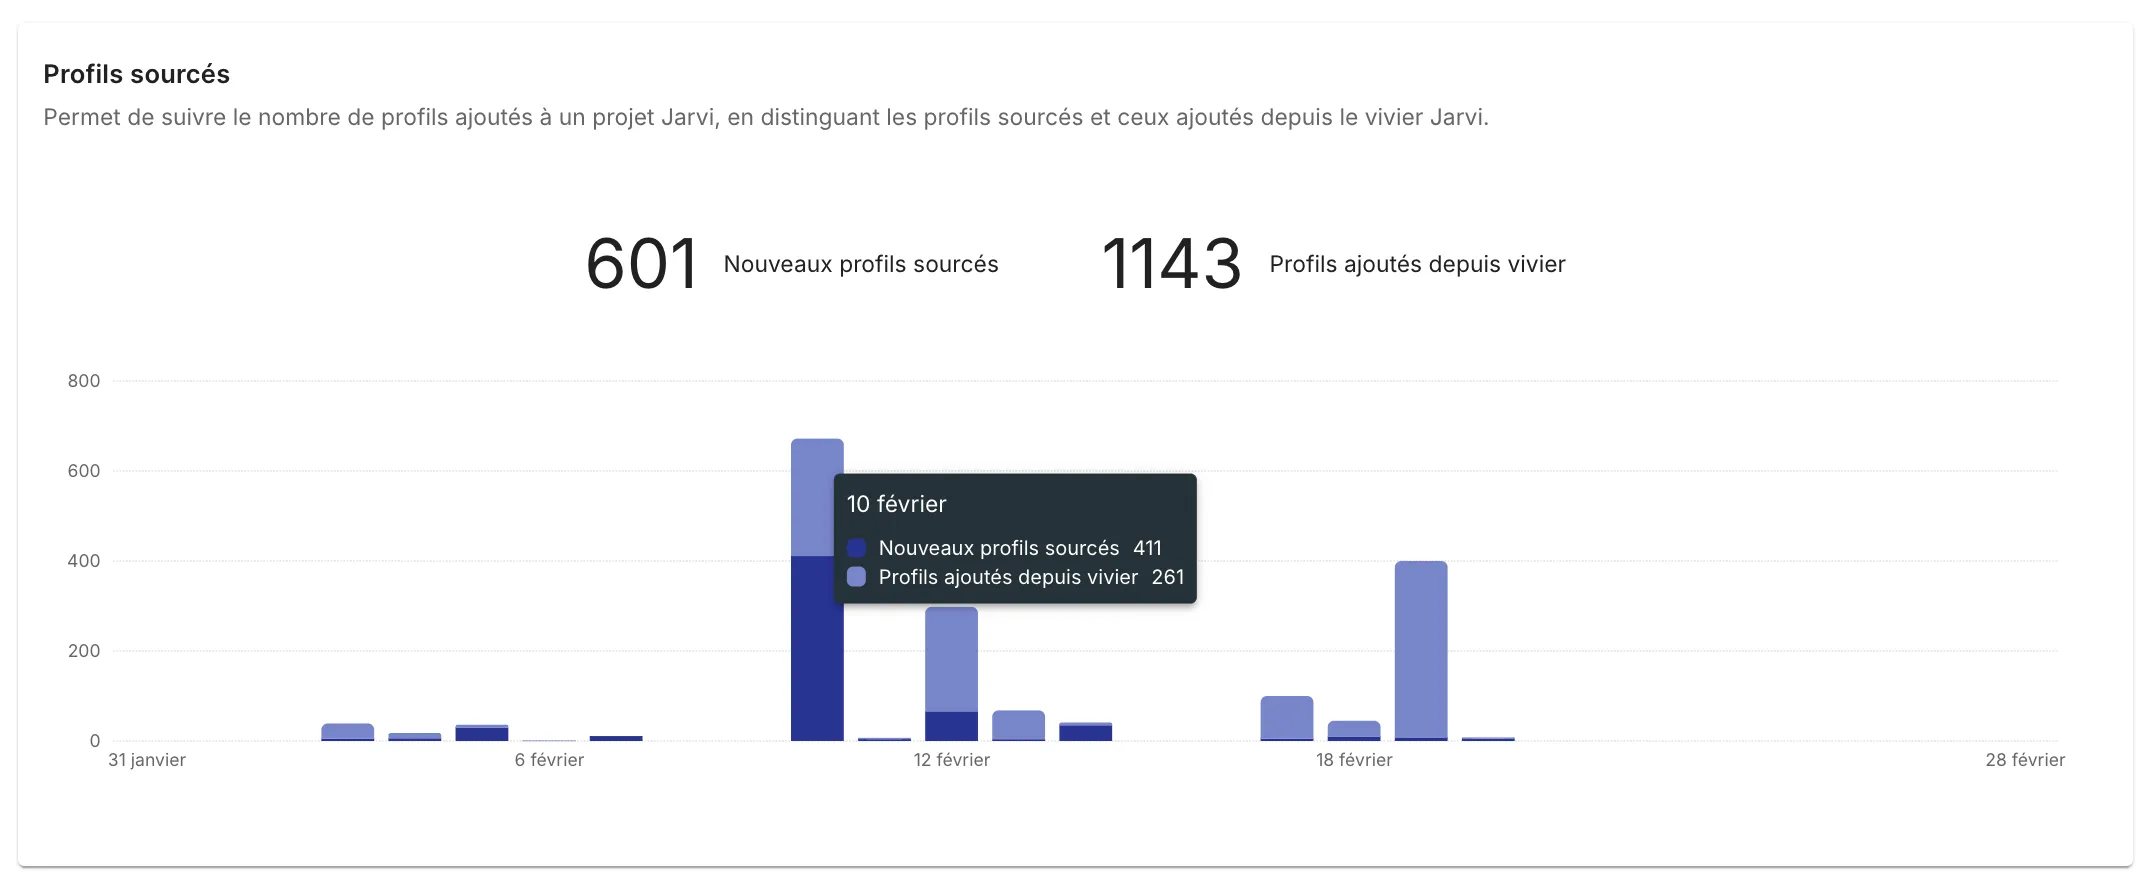
- Check the number of sourced profiles and added to your talent pool over a given period.
- Analyze the response rate by channel (emails, LinkedIn, etc.).
- Track the effectiveness of your candidate outreach and conversion rate.
- Refine your analysis by clicking on a column to see the weekly breakdown.
Recruitment process
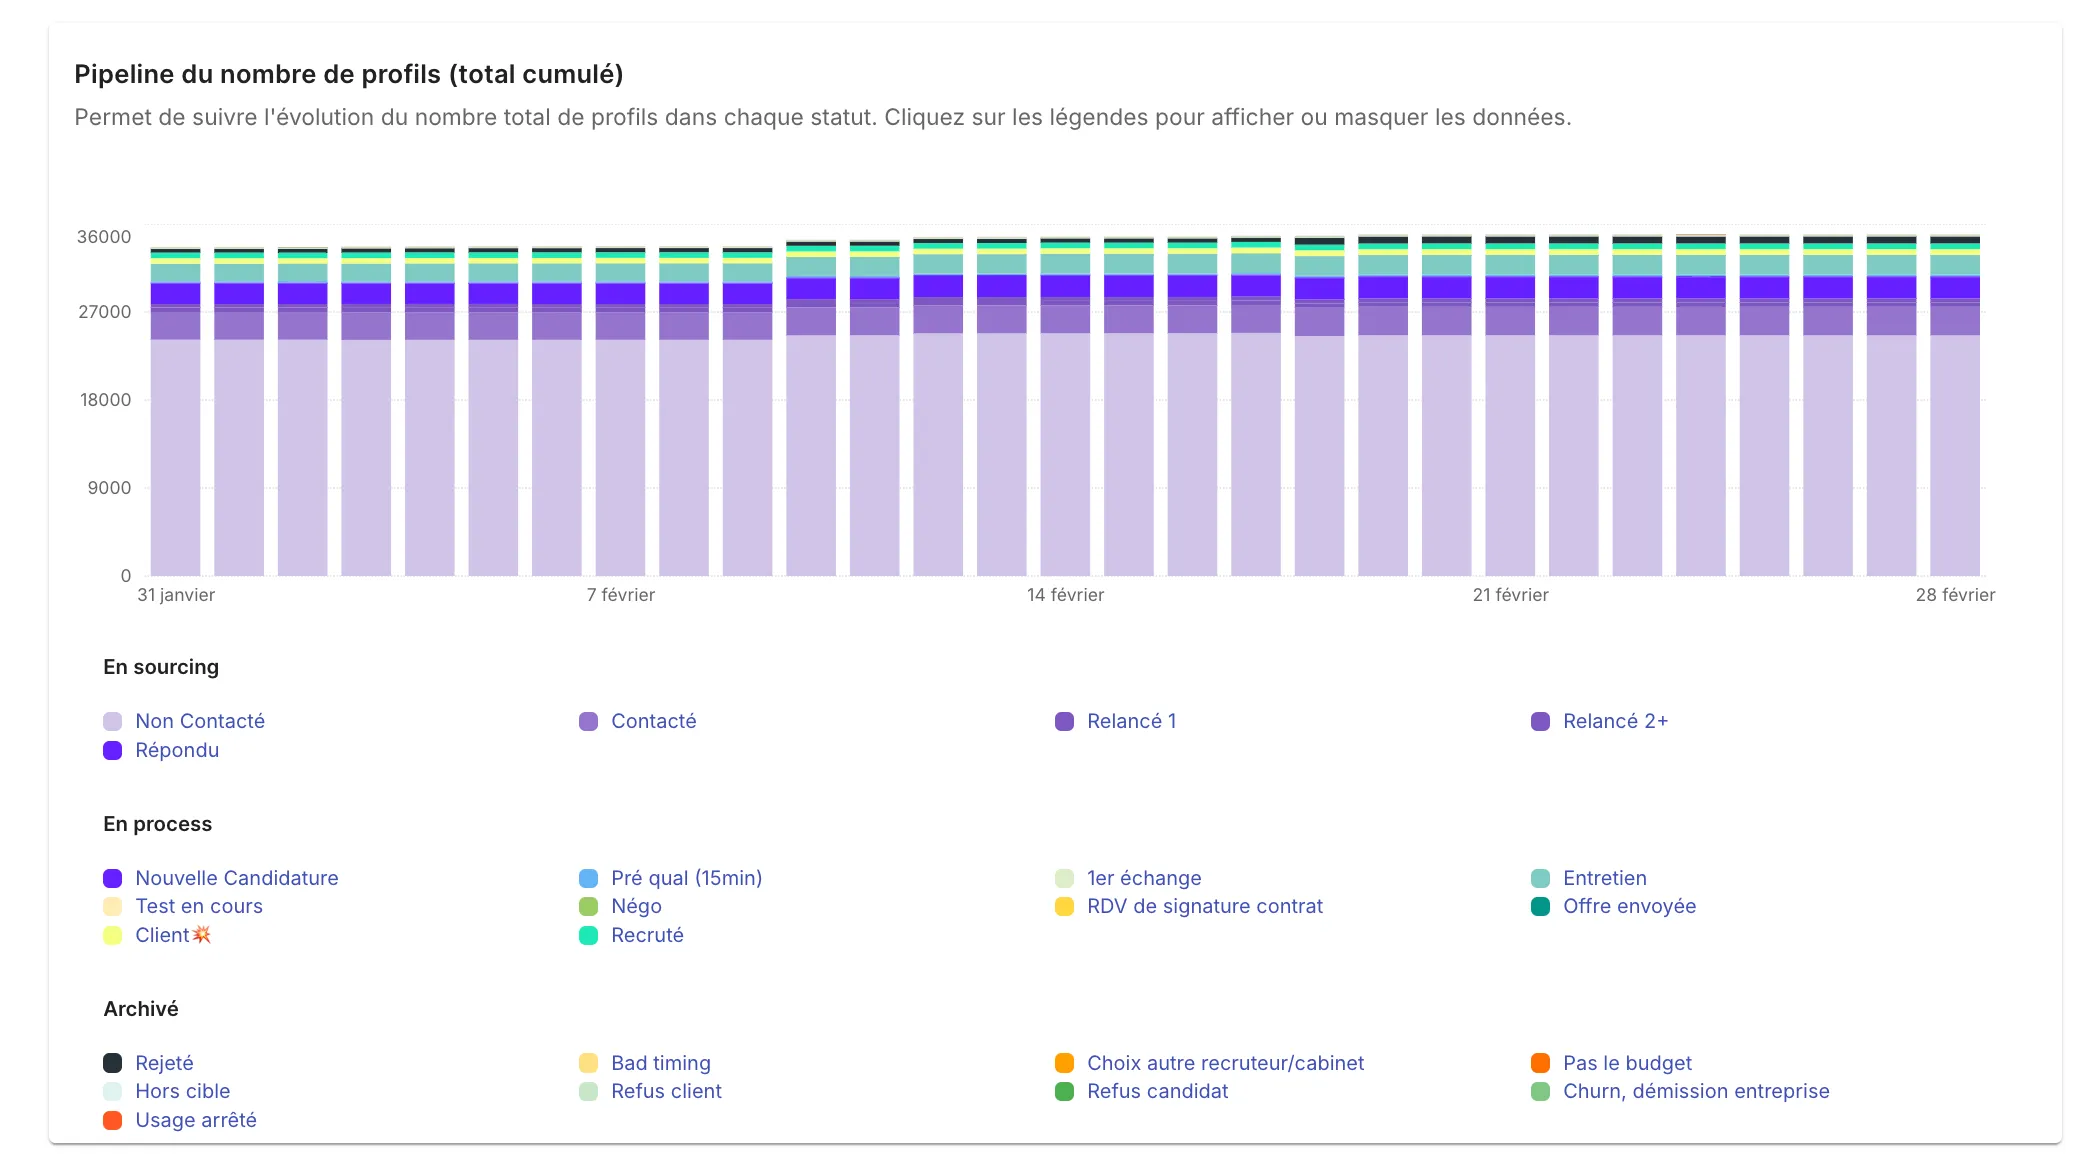
- Visualize the distribution of profiles in each recruitment stage.
- Track candidate progression (pre-qualification, interview, offer sent, hired, etc.).
- Export your data in CSV or Excel for deeper analysis.
- Check the average time spent between stages and the conversion rate.
Recruitment projects
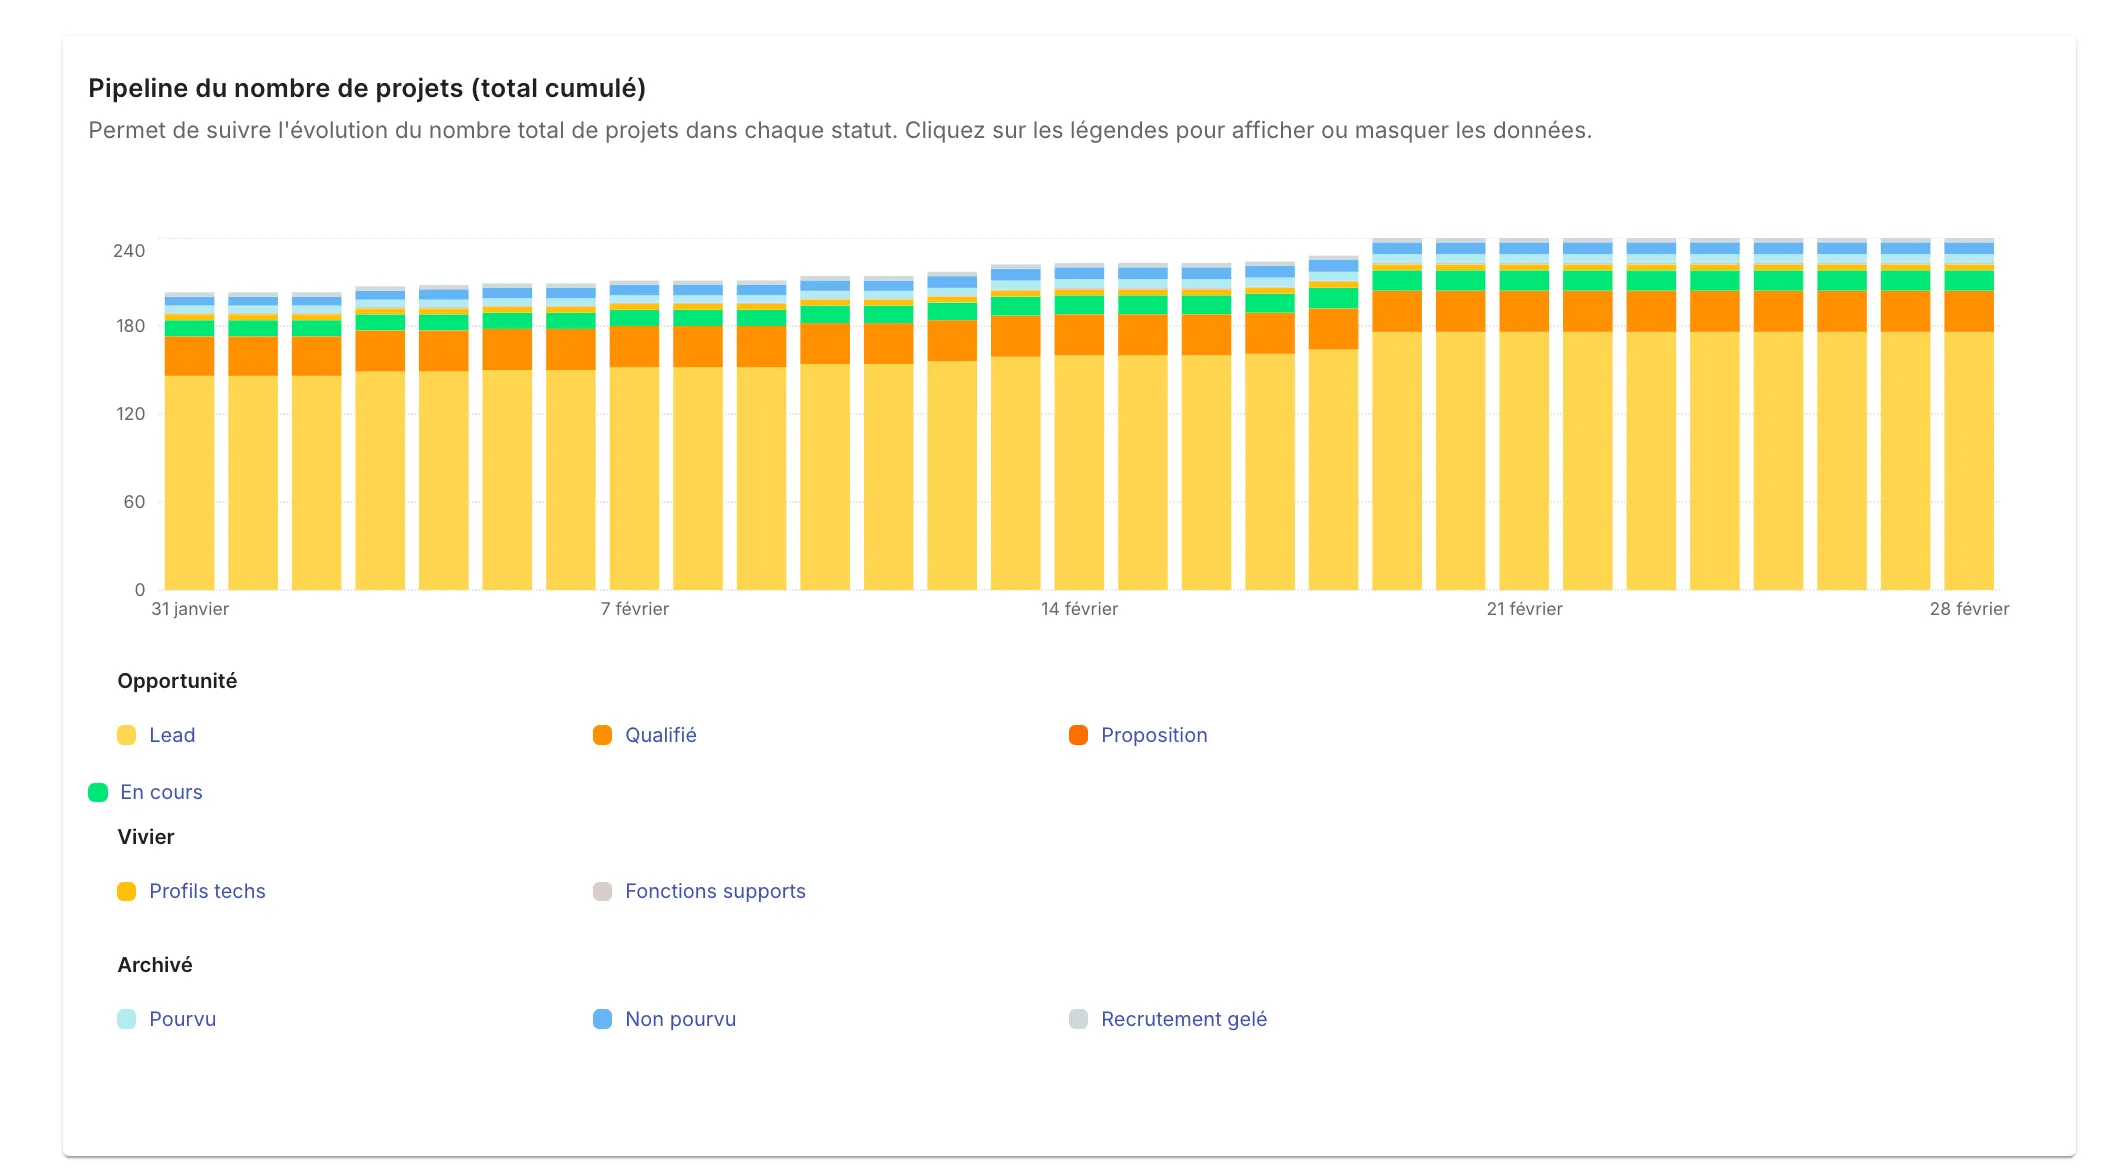
- Analyze the volume of projects at each stage (lead, qualified, in progress, finalized, etc.).
- Identify priority projects to work on.
- Track the evolution of your projects and their progress in the pipeline.
- Export data in CSV or Excel to present your analyses.
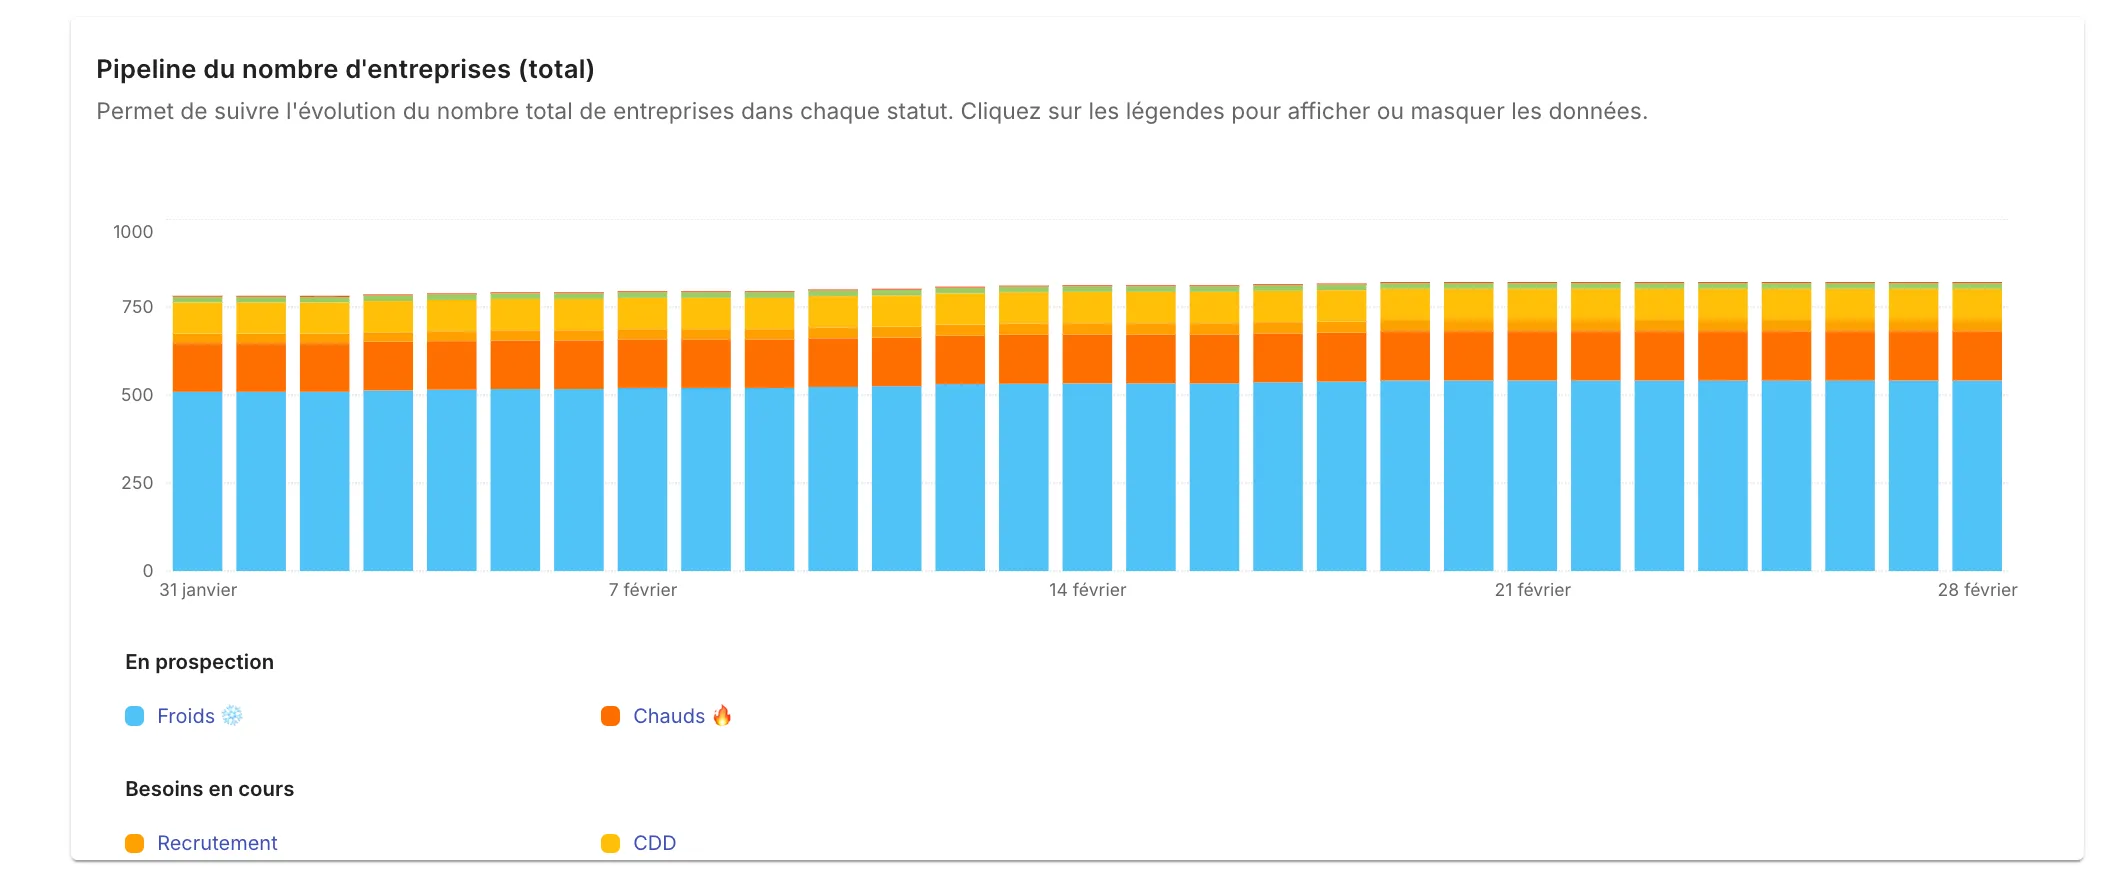
Companies
- Check the status of companies (cold prospects, warm prospects, clients, etc.).
- Analyze the evolution of companies based on their status.
- Observe the conversion of companies into clients.
- Track interactions and engagement of companies with your team.
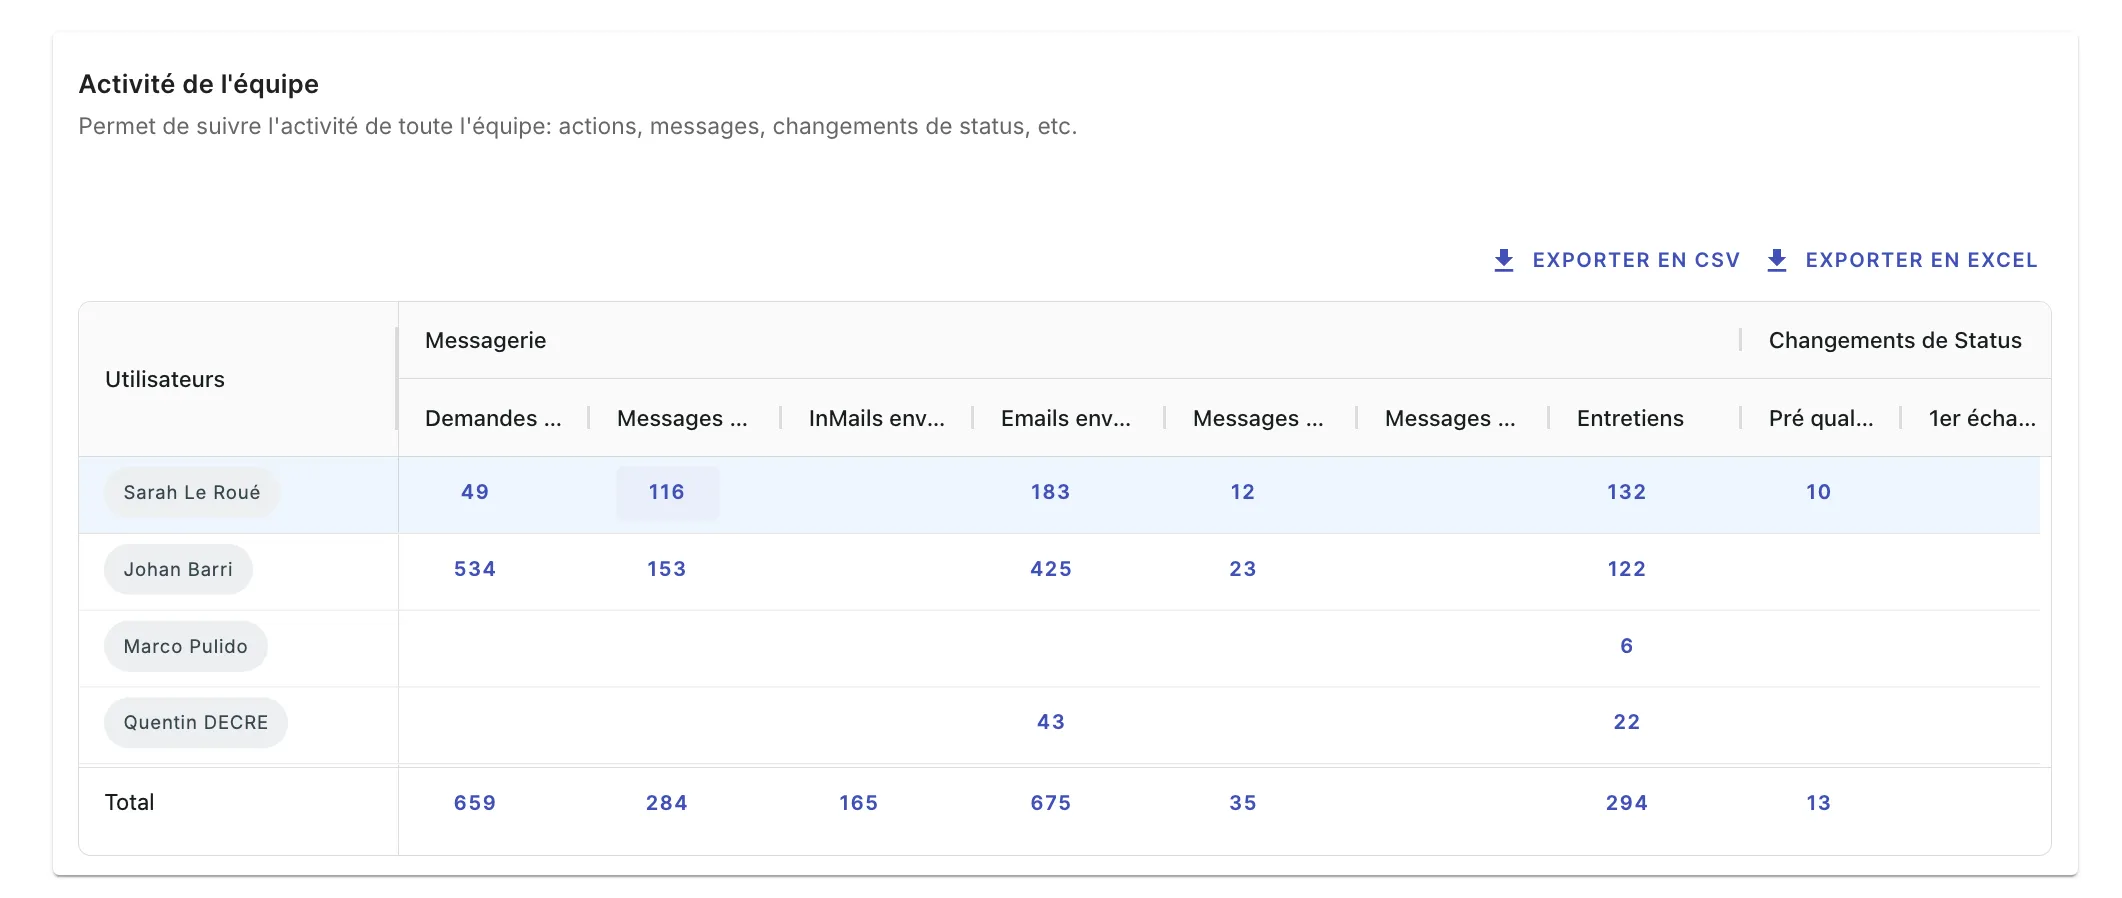
Team activity
- Track recruiter activity: number of LinkedIn requests sent, emails sent, etc.
- Analyze the volume of actions performed by recruiter.
- Optimize your strategy based on individual and collective performance.
That’s it! You now know how to use statistics in Jarvi to optimize your activity.